CoreLogic Reports National Home Prices Rose by 6.9 Percent Year Over Year in July 2015
—Home Prices Projected to Increase by 4.7 Percent Year Over Year by July 2016—
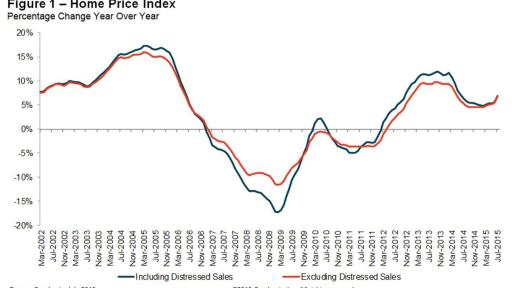
PR Newswire, IRVINE, Calif., September 1, 2015 — CoreLogic® (NYSE: CLGX), a leading global property information, analytics and data-enabled services provider, today released its July 2015 CoreLogic Home Price Index (HPI®) which shows that home prices nationwide, including distressed sales, increased by 6.9 percent in July 2015 compared with July 2014. On a month-over-month basis, home prices nationwide, including distressed sales, increased by 1.7 percent in July 2015 compared with June 2015*.
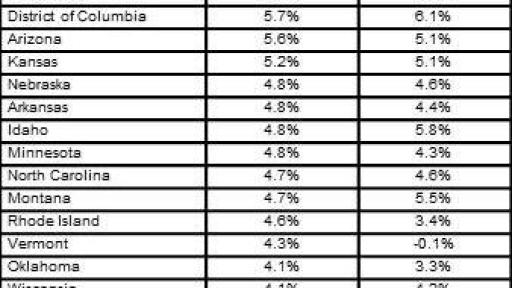
Including distressed sales, only Colorado has more than 10 percent year-over-year growth. Additionally, only 10 states have experienced increased growth in the last year that matched or surpassed the nation as a whole; those states are: Colorado, Florida, Hawaii, Nevada, New York, Oregon, South Carolina, South Dakota, Texas and Washington. Fifteen states reached new price peaks since January 1976 when the index began including Alaska, Arkansas, Colorado, Hawaii, Iowa, Kentucky, Montana, Nebraska, New York, North Carolina, North Dakota, Oklahoma, South Dakota, Tennessee and Texas. Only two states experienced home price depreciation: Massachusetts (-2.1 percent) and Mississippi (-0.8 percent).
Excluding distressed sales, home prices increased by 6.7 percent in July 2015 compared with July 2014 and increased by 1.5 percent month over month compared with June 2015. Excluding distressed sales, only West Virginia (-0.3 percent) and Vermont (-0.1 percent) showed year-over-year home price depreciation in July. Distressed sales include short sales and real estate-owned (REO) transactions.
The CoreLogic HPI Forecast indicates that home prices, including distressed sales, are projected to increase by 0.5 percent month over month from July 2015 to August 2015 and by 4.7 percent** on a year-over-year basis from July 2015 to July 2016. Excluding distressed sales, home prices are projected to increase by 0.4 percent month over month from July 2015 to August 2015 and by 4.6 percent** year over year from July 2015 to July 2016. The CoreLogic HPI Forecast is a projection of home prices using the CoreLogic HPI and other economic variables. Values are derived from state-level forecasts by weighting indices according to the number of owner-occupied households for each state.
“Home sales continued their brisk rebound in July and home prices reflected that, up 6.9 percent from a year ago,” said Frank Nothaft, chief economist for CoreLogic. “Over the same period, the National Association of Realtors reported existing sales up 10 percent and the Census Bureau reported new home sales up 26 percent in July.”
“Low mortgage rates and stronger consumer confidence are supporting a resurgence in home sales of late,” said Anand Nallathambi, president and CEO of CoreLogic. “Adding to overall housing demand is the benefit of a better labor market which has provided millennials the financial independence to form new households and escape ever-rising rental costs.”
Highlights as of July 2015:
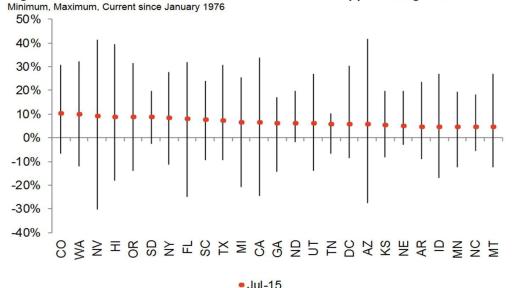
- Including distressed sales, the five states with the highest home price appreciation were: Colorado (+10.4 percent), Washington (+9.9 percent), Nevada (+9.1 percent), Hawaii (+8.9 percent) and Oregon (+8.8 percent).
- Excluding distressed sales, the five states with the highest home price appreciation were: Colorado (+10.1 percent), Washington (+9.5 percent), Nevada (+9.1 percent), Oregon (+9.1 percent) and New York (+9 percent).
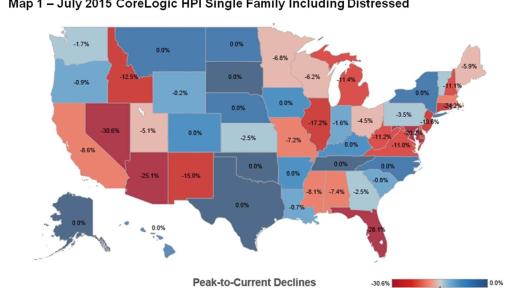
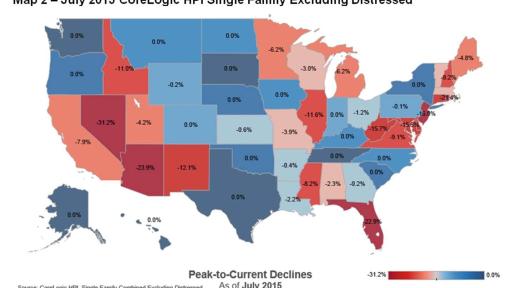
- Including distressed transactions, the peak-to-current change in the national HPI (from April 2006 to July 2015) was -6.6 percent. Excluding distressed transactions, the peak-to-current change for the same period was -3.5 percent.
- Including distressed transactions, the five states with the largest peak-to-current declines were: Nevada (-30.6 percent), Florida (-28.1 percent), Arizona (-25.1 percent), Rhode Island (-24.2 percent) and Maryland (-20.2 percent).
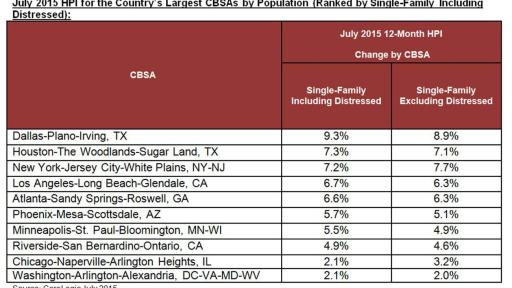
- Of the top 100 Core Based Statistical Areas (CBSAs) measured by population, 95 showed year-over-year increases. The five CBSAs that showed year-over-year declines were: Baltimore-Columbia-Towson, MD (-0.3 percent); Boston, MA (-3.8 percent); New Haven-Milford, CT (-1.9 percent); New Orleans-Metairie, LA (-4.9 percent) and Worcester, MA-CT (-7.2 percent).
*June data was revised. Revisions with public records data are standard, and to ensure accuracy, CoreLogic incorporates the newly released public data to provide updated results.
**The forecast accuracy represents a 95-percent statistical confidence interval with a +/- 2.0 percent margin of error for the index including distressed sales and a +/- 2.0 percent margin of error for the index excluding distressed sales.
July National and State HPI (Ranked by Single Family Including Distressed)
Figure 1: Home Price Index
Percentage Change Year Over Year
Figure 2: YoY HPI Growth for 25 Fastest-Appreciating States
Min, Max, Current Since January 1976
Methodology
The CoreLogic HPI™ incorporates more than 30 years’ worth of repeat sales transactions, representing more than 65 million observations sourced from CoreLogic industry-leading property information and its securities and servicing databases. The CoreLogic HPI provides a multi-tier market evaluation based on price, time between sales, property type, loan type (conforming vs. nonconforming) and distressed sales. The CoreLogic HPI is a repeat-sales index that tracks increases and decreases in sales prices for the same homes over time, including single-family attached and single-family detached homes, which provides a more accurate “constant-quality” view of pricing trends than basing analysis on all home sales. The CoreLogic HPI provides the most comprehensive set of monthly home price indices available covering 7,333 ZIP codes (60 percent of total U.S. population), 667 Core Based Statistical Areas (89 percent of total U.S. population) and 1,300 counties (86 percent of total U.S. population) located in all 50 states and the District of Columbia. Forecast ranges provided in this report are based on a 95 percent confidence interval.
Source: CoreLogic
The data provided are for use only by the primary recipient or the primary recipient’s publication or broadcast. This data may not be resold, republished or licensed to any other source, including publications and sources owned by the primary recipient’s parent company without prior written permission from CoreLogic. Any CoreLogic data used for publication or broadcast, in whole or in part, must be sourced as coming from CoreLogic, a data and analytics company. For use with broadcast or web content, the citation must directly accompany first reference of the data. If the data are illustrated with maps, charts, graphs or other visual elements, the CoreLogic logo must be included on screen or website. For questions, analysis or interpretation of the data, contact Lori Guyton at [email protected] or Bill Campbell at [email protected]. Data provided may not be modified without the prior written permission of CoreLogic. Do not use the data in any unlawful manner. The data are compiled from public records, contributory databases and proprietary analytics, and its accuracy is dependent upon these sources.
About CoreLogic
CoreLogic (NYSE: CLGX) is a leading global property information, analytics and data-enabled services provider. The company’s combined data from public, contributory and proprietary sources includes over 4.5 billion records spanning more than 50 years, providing detailed coverage of property, mortgages and other encumbrances, consumer credit, tenancy, location, hazard risk and related performance information. The markets CoreLogic serves include real estate and mortgage finance, insurance, capital markets, and the public sector. CoreLogic delivers value to clients through unique data, analytics, workflow technology, advisory and managed services. Clients rely on CoreLogic to help identify and manage growth opportunities, improve performance and mitigate risk. Headquartered in Irvine, Calif., CoreLogic operates in North America, Western Europe and Asia Pacific. For more information, please visit www.corelogic.com.
CORELOGIC, the CoreLogic logo, CoreLogic HPI, CoreLogic HPI Forecast and HPI are trademarks of CoreLogic, Inc. and/or its subsidiaries.
For real estate industry and trade media:
Bill Campbell
[email protected]
212-995-8057
For general news media:
Lori Guyton
[email protected]
901-277-6066
###


